
US ten-year Treasury yield hits 5.31%, approaching 2002 highs as Fed holds target range
The ten-year Treasury yield climbs three basis points to 5.31%, a level not seen since the early 2000s, against a backdrop of stable rates.
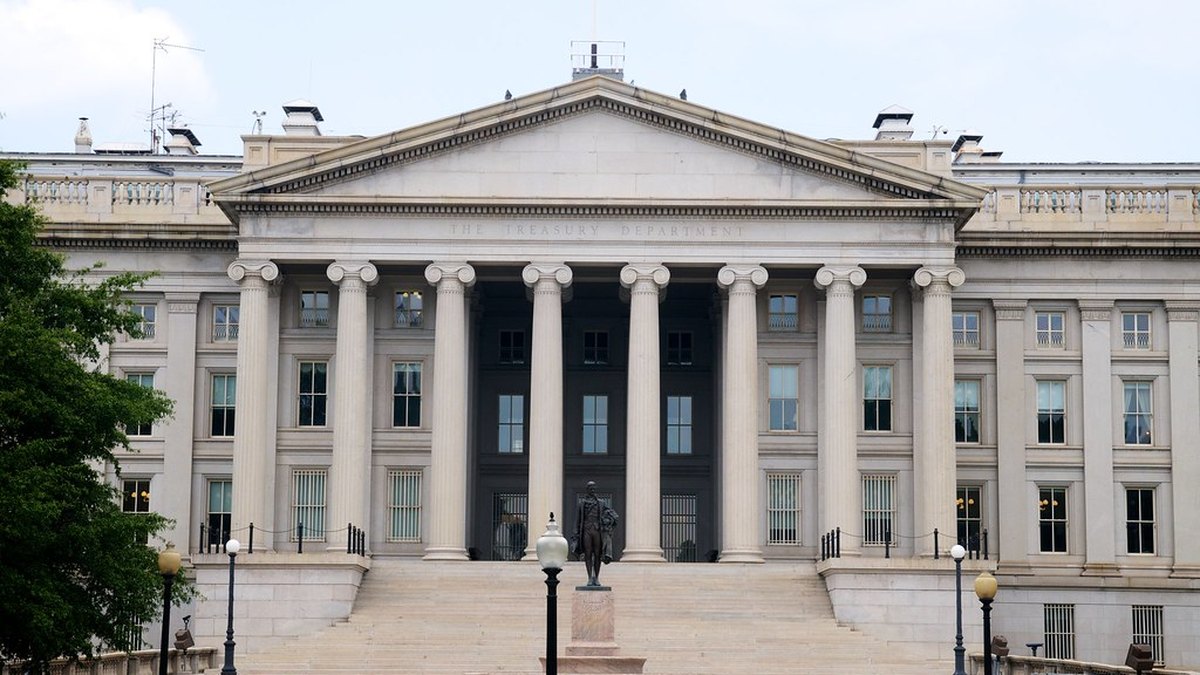
The US Treasury Department in Washington, issuer of the world’s benchmark sovereign debt. Photo: @mikepick · CC BY 2.0 · via flickr
The yield on the ten-year US Treasury has climbed three basis points and is trading today at 5.31%, approaching the highs recorded in 2002. The rate remains in territory not visited since the beginning of that year, a move reflecting tensions in a market digesting the coexistence of elevated official rates with a cooling labour market.
The Federal Reserve is maintaining its target range at 3.75-4.0%, with the effective federal funds rate at 3.88% according to the latest data from the Federal Reserve Bank of New York dated 2 October. Meanwhile, the government bond market continues to drive yield requirements higher at the long end of the curve.
Weak employment and stable rates: a delicate cocktail
The latest official employment data, corresponding to September 2026, shows an increase of just twenty-nine thousand jobs in non-farm payrolls, which stand at 159,044 thousand. The unemployment rate rose by a tenth of a percentage point to 4.2%, whilst average hourly earnings stood at $37.81, five cents higher than in August.
This weakening of the labour market contrasts with the absence of changes in the Fed’s monetary policy, which has left its target range untouched despite cooling signals. The combination generates uncertainty about the future pace of cuts and pushes long-term yields higher.
The ten-year Treasury is trading at levels not seen since the early 2000s, challenging the soft landing narrative.
Inflation remains above target
The latest inflation data, corresponding to August 2026, places year-on-year CPI at 3.4%, well above the Fed’s 2% target. The consumer price index registered a value of 334.98, with a monthly advance of 0.3%. Core inflation, which excludes food and energy, remains at 2.4% year-on-year.
These figures reinforce the central bank’s caution regarding any premature movement in rates. The bond market interprets that room to ease monetary policy remains narrow, sustaining upward pressure on yields.
What does a ten-year yield at 5.31% imply?
A yield of 5.31% on the ten-year Treasury raises the cost of financing for companies and households, and competes directly with equities as an investment destination. Moreover, it acts as a reference for the valuation of risk assets: the higher the risk-free rate, the less attractive stocks and corporate bonds with similar premia become.
The long end of the curve also reflects expectations of persistent inflation and moderate growth. If the market is pricing in that the Fed will maintain restrictive rates for longer than initially expected, the slope of the curve tends to steepen and ten-year yields rise.
What to watch
The next FOMC meeting and the minutes to be published in the coming days will provide clarity on the Fed’s stance regarding these yield levels. October employment data and the evolution of core inflation, which sets the real pulse of price pressures, will also need to be monitored.
Disclaimer: informational content. Trading and investing carry risk of loss, including loss of entire capital. This is not investment advice.
Related · Onyqdesk tools
Sources: official US series (BLS, Federal Reserve, Treasury) via Alpha Vantage and news aggregator.
🇪🇸 Versión en español: El bono a diez años estadounidense alcanza el 5,31% y roza máximos de 2002 mientras la Fed mantiene el rango objetivo
What if the next piece reached you before it happened?
Monday to Friday, 1h35 before the New York cash open: the pre-market with levels, the calendar and the trading idea of the day. On Sunday, the weekly wrap and the week ahead. Free. No spam. One click to unsubscribe.


Leave A Comment
You must be logged in to post a comment.