
US inflation data due Wednesday with Nasdaq and S&P 500 near 52-week highs
Futures reopen on Sunday evening and cash equities on Monday. US consumer price data arrives Wednesday and producer prices plus retail sales Thursday. Technical levels across equities, futures, gold and bitcoin.
It is the weekend: Nasdaq, S&P 500 and gold futures resume on Sunday at 23:00 London time, while the regular US equity session does not open until Monday. Equity, futures and gold prices cited below are Friday’s close. Only bitcoin is trading at present.
All levels in this review come from the newsroom’s free-access tools: open interest levels, the liquidations map and the economic calendar.
The week in data
The week of October 5 to 9 brought Monday October 5 at 14:00 UTC the US ISM services PMI, which came in at 54.9 against an expectation of 55.1 and a prior reading of 55.4.
The week ahead, October 12 to 16, brings a heavy US data calendar. Wednesday October 14 at 12:30 UTC delivers the full inflation set: monthly CPI (0.4% prior), year-on-year CPI (3.4% prior, matching the August 2026 year-on-year change in the official index), monthly core CPI (0.3% prior) and year-on-year core CPI (2.4% prior, matching the August 2026 year-on-year change in the core index), all without forecasts on the newsroom’s calendar. Thursday October 15 at 12:30 UTC brings monthly core producer prices (0.2% prior), monthly producer prices (0.4% prior), monthly retail sales (1.2% prior), monthly core retail sales (1.4% prior), the Philadelphia Fed manufacturing index (37.8 prior) and weekly jobless claims (197,000 prior), all without forecasts on the newsroom’s calendar. At 06:00 UTC the United Kingdom releases monthly GDP (0.4% prior), with no forecast in our calendar.
Equities
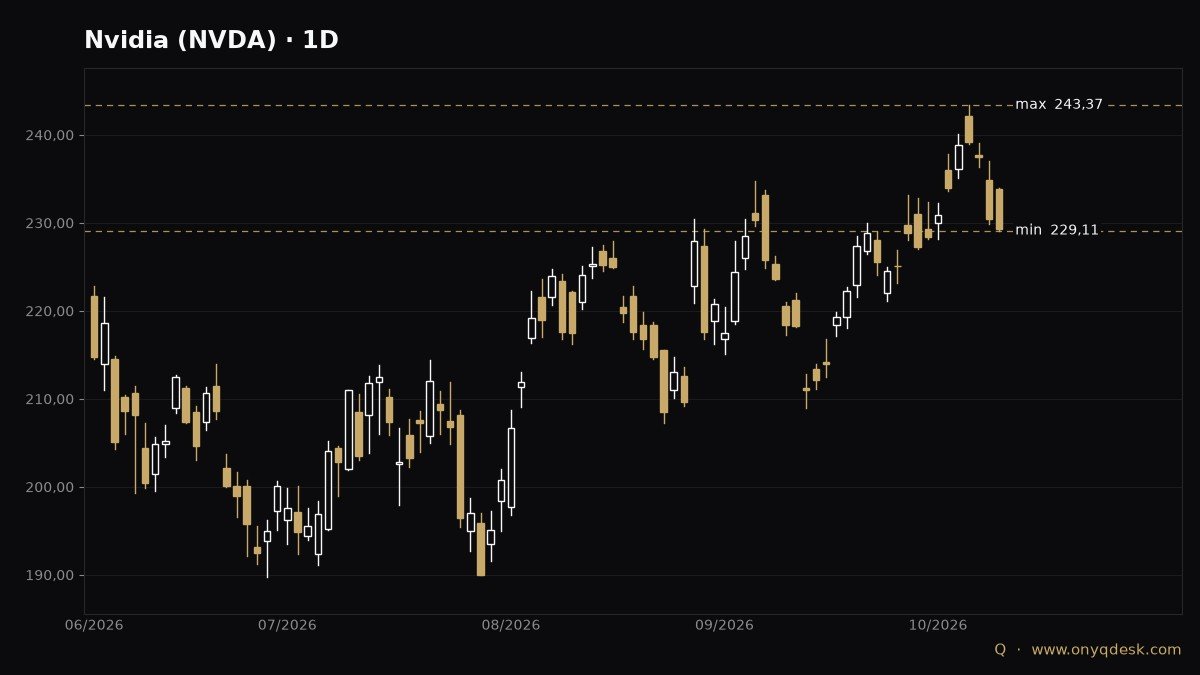
Nvidia closed the week around $229, down 2.0% on the week. The stock sits 5.79% below its 52-week high of around $243, which matches the weekly high. The week’s range ran from approximately $229 to $243.
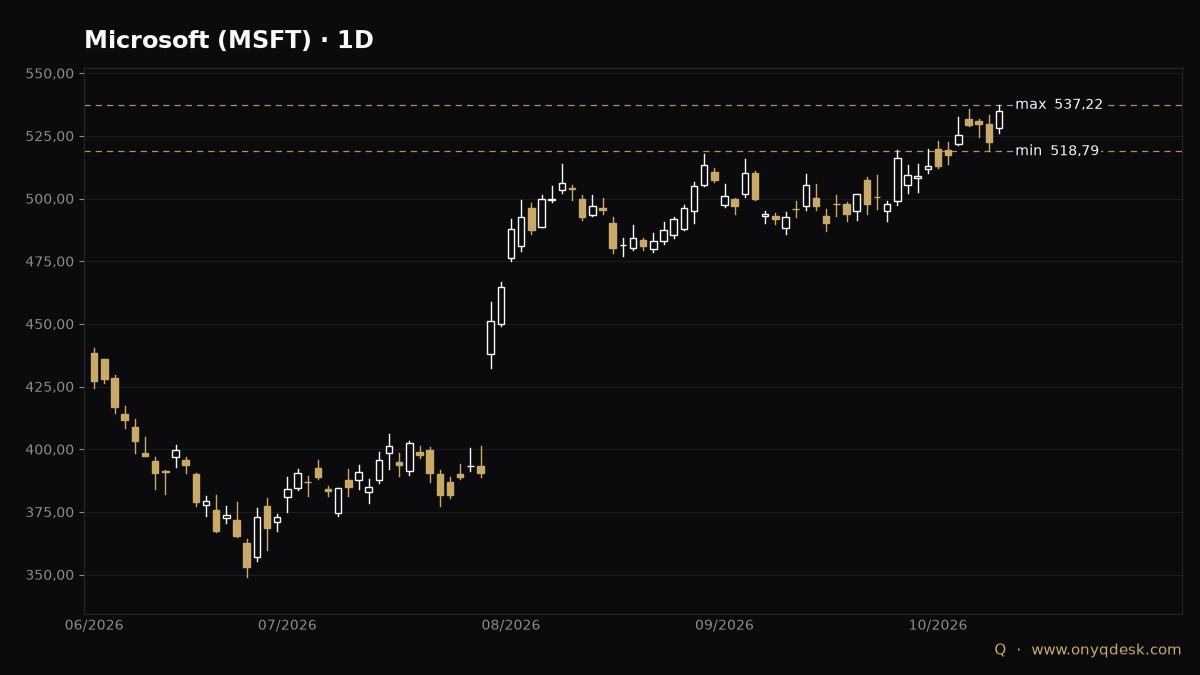
Microsoft closed around $535, up 3.39% for the week. The stock sits 3.37% below its 52-week high of around $554. The weekly range ran from around $519 to $537.
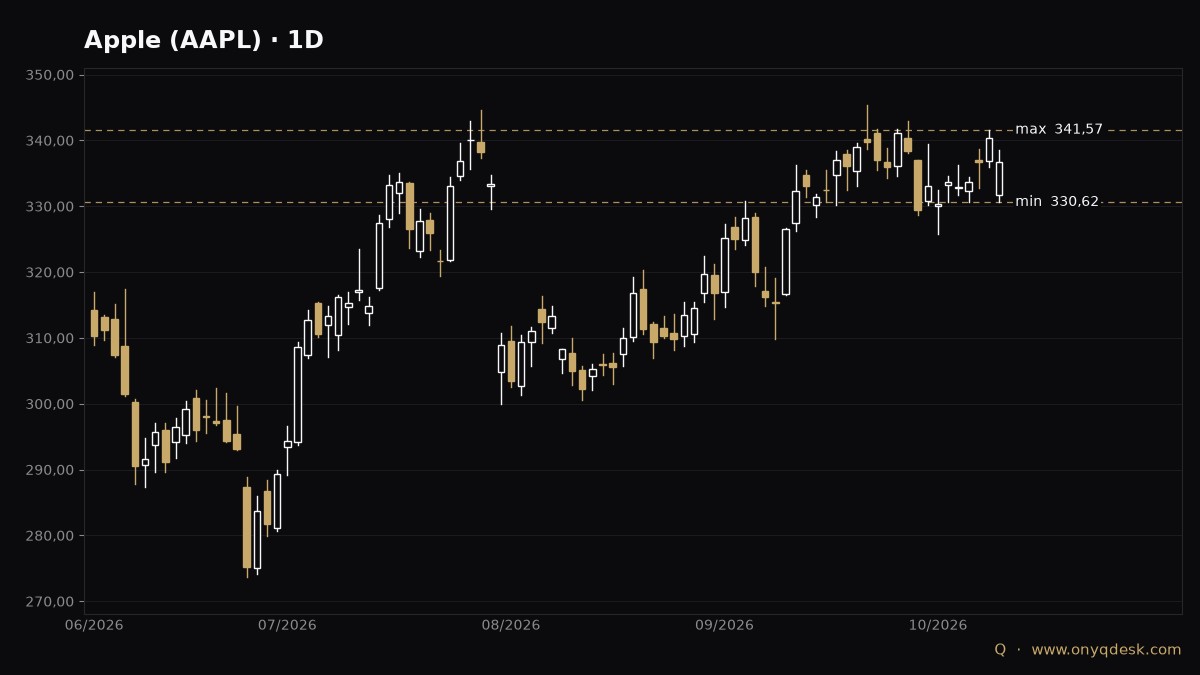
Apple finished the week around $337, up 0.88%. The stock stands 2.52% below its 52-week high of around $345. The week’s range ran from approximately $331 to $342.
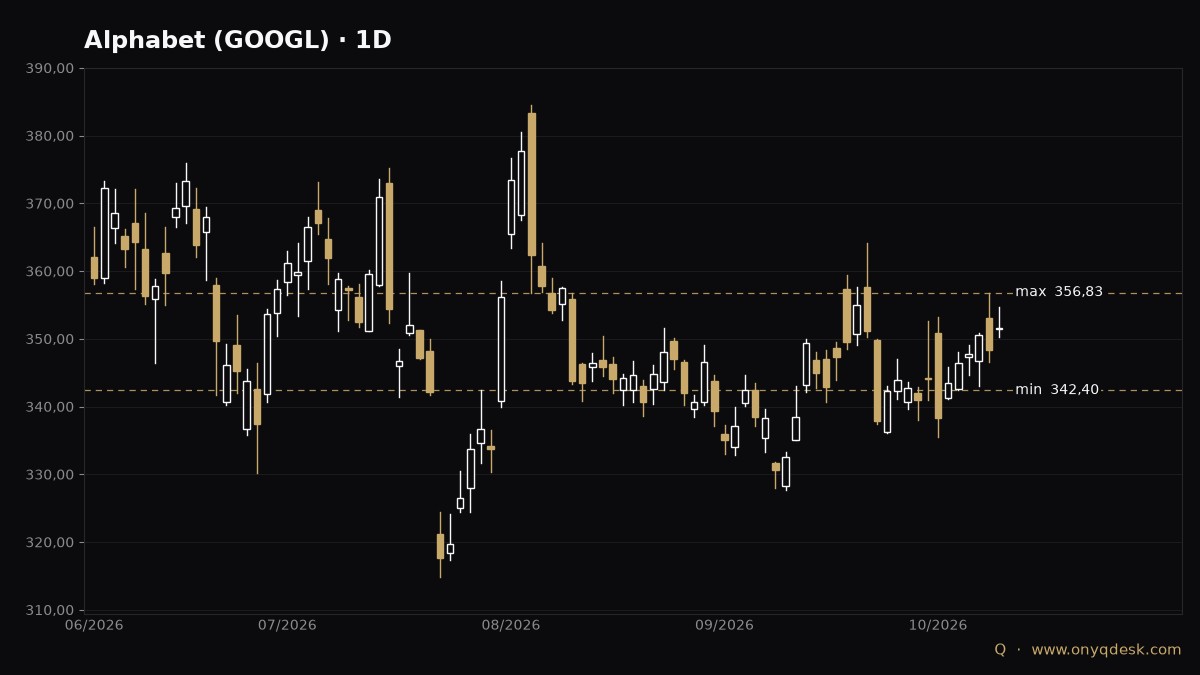
Alphabet closed around $352, up 2.38% on the week. The stock sits 13.94% below its 52-week high of around $409. The weekly range ran from approximately $342 to $357.
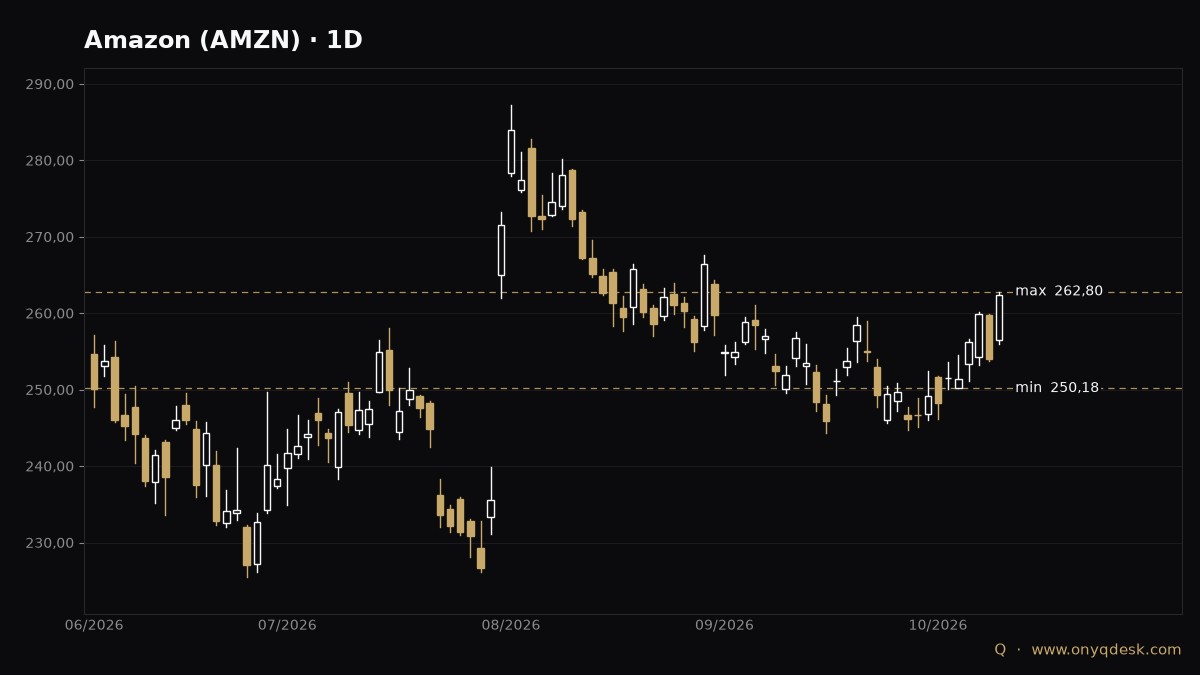
Amazon finished the week around $262, up 4.34%. The stock stands 8.62% below its 52-week high of around $287. The week’s range ran from approximately $250 to $263.
Nasdaq and S&P 500 futures
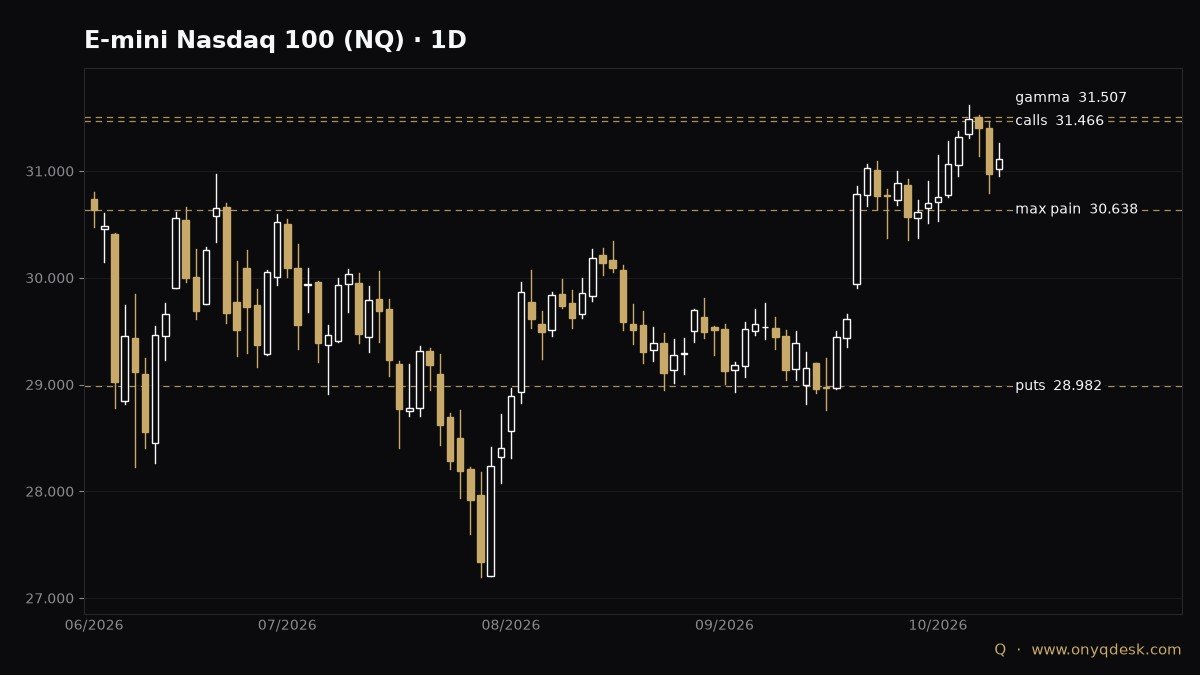
The E-mini Nasdaq 100 contract closed the week around 31,100 points, up 0.15%. The weekly range ran from around 30,800 to 31,600 points, with the latter matching the 52-week high. The contract sits 1.61% below that high.
Open interest levels for QQQ options expiring in the week ahead, translated to futures prices, put max pain—the price at which expiring options collectively leave least value to buyers—around 30,600 points. The call wall, the strike with the most open call contracts above the price and generally read as resistance, stands around 31,500 points with some 72,500 contracts. The put wall, the strike with the most open put contracts below the price and generally read as support, stands around 29,000 points with some 61,300 contracts. The gamma flip, the level at which estimated collective gamma exposure changes sign—above which market-maker hedging tends to dampen moves and below which it tends to amplify them—sits around 31,500 points. The put/call ratio is 1.78 open put contracts per call contract.
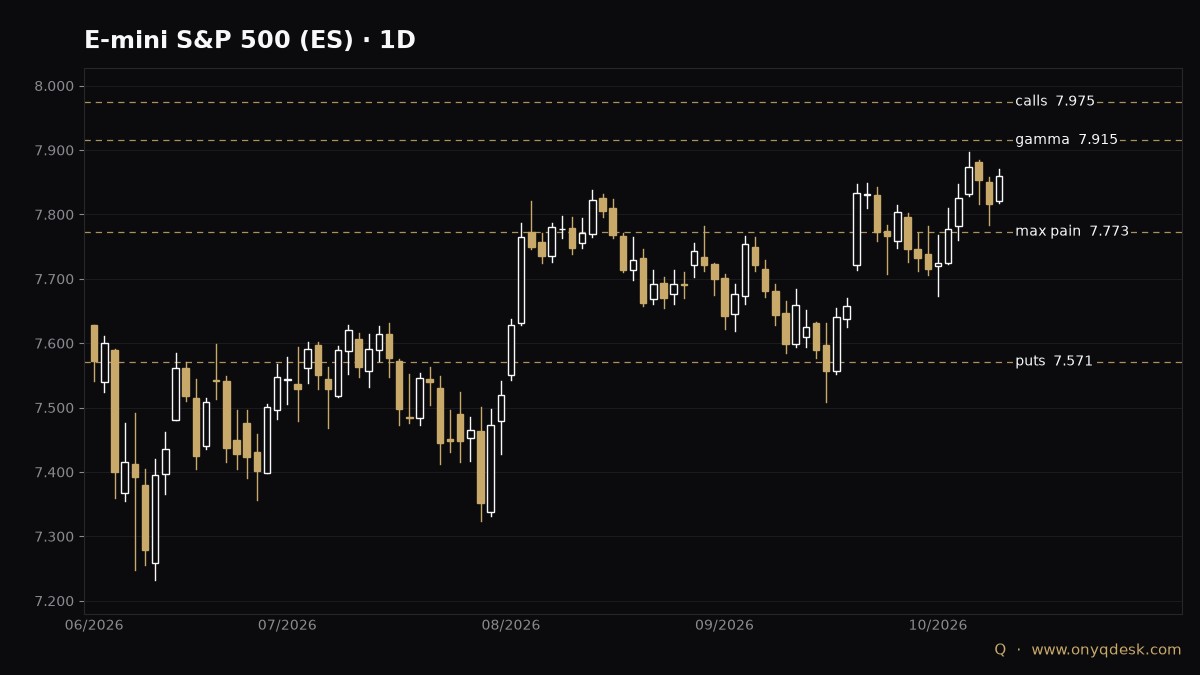
The E-mini S&P 500 contract closed the week around 7,860 points, up 1.06%. The weekly range ran from around 7,760 to 7,900 points, with the latter matching the 52-week high. The contract stands 0.48% below that high.
Open interest levels for SPY options expiring in the week ahead, translated to futures prices, put max pain around 7,770 points. The call wall stands around 7,970 points with some 66,500 contracts. The put wall sits around 7,570 points with some 76,000 contracts. The gamma flip stands around 7,920 points. The put/call ratio is 2.91 open put contracts per call contract.
Gold
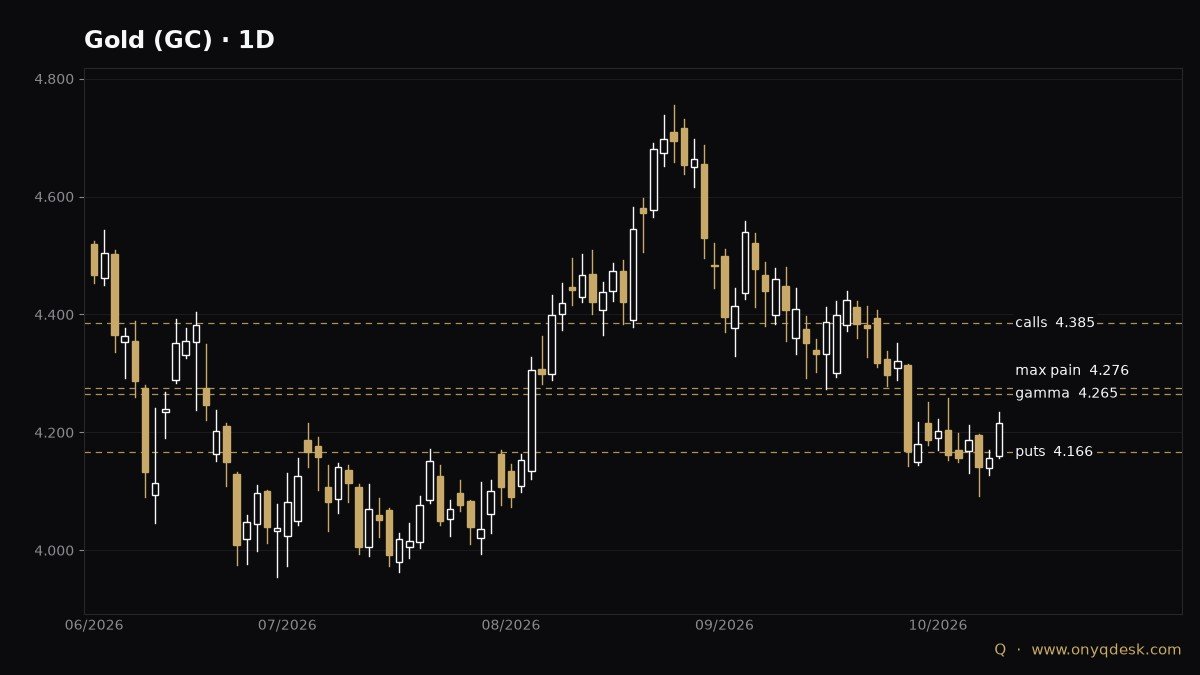
Gold closed the week around $4,220 per troy ounce, up 1.3%. The weekly range ran from approximately $4,090 to $4,230. The metal sits 24.52% below its 52-week high of around $5,590.
Open interest levels for GLD options expiring in the week ahead, translated to futures prices, put max pain around $4,280. The call wall stands around $4,390 with some 22,300 contracts. The put wall sits around $4,170 with some 11,800 contracts. The gamma flip stands around $4,270. The put/call ratio is 0.62 open put contracts per call contract.
Bitcoin
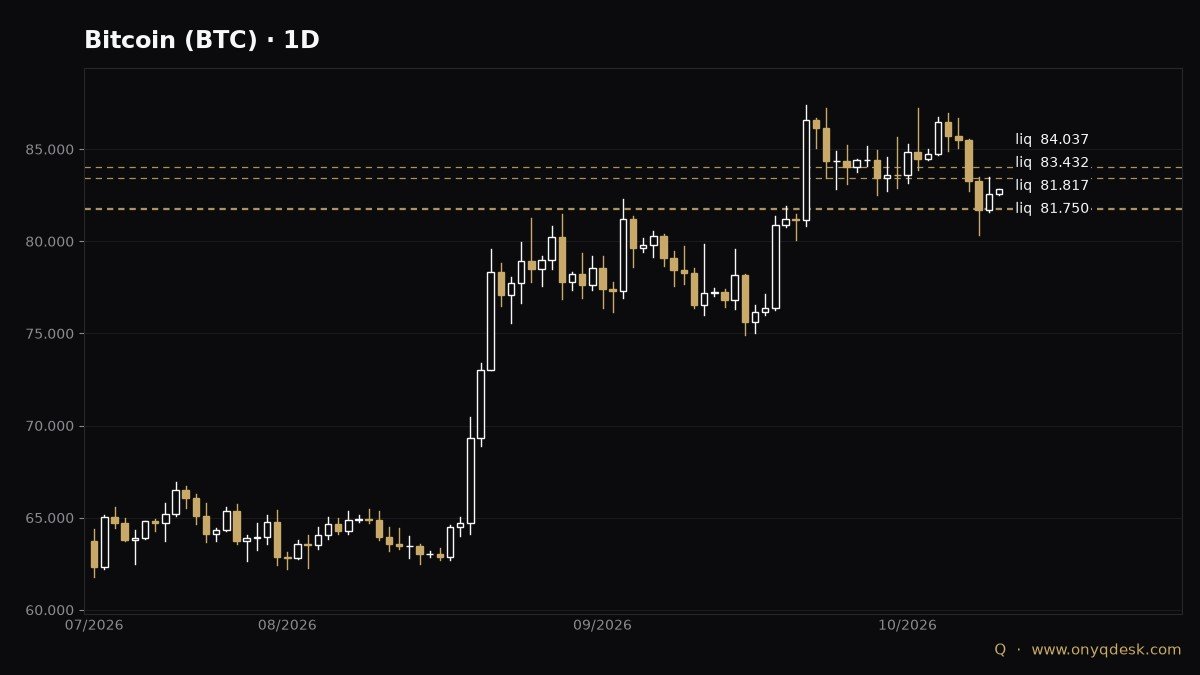
Bitcoin is trading around $82,800, down 2.25% over the past seven days. The range over that period ran from approximately $80,300 to $87,000.
The newsroom’s liquidations map, which estimates volume distributed across 100×, 50× and 25× leverage and which remains live until price touches it, puts three estimated liquidity levels above the current price: around $83,400 with an estimated $330 million, around $84,000 with $243 million and around $84,200 with $192 million. Below price, the three main levels sit around $81,700 with an estimated $416 million, around $81,800 with $230 million and around $80,900 with $191 million.
Open interest in the BTC perpetual contract on Binance stands around 92,500 contracts, equivalent to some $7.6 billion, down 5.76% over seven days. Funding is -0.0015% every eight hours, meaning shorts are paying longs.
Wednesday brings the full set of US inflation data, without forecasts on the newsroom’s calendar, and Thursday delivers producer prices and retail sales.
What to watch
Wednesday October 14 at 12:30 UTC: the full set of US inflation data (monthly CPI, year-on-year CPI, monthly core CPI, year-on-year core CPI), all without forecasts on the newsroom’s calendar. Thursday October 15 at 06:00 UTC: UK monthly GDP (0.4% prior), without forecast. Thursday October 15 at 12:30 UTC: US monthly core producer prices, monthly producer prices, monthly retail sales and monthly core retail sales, all without forecasts.
Disclaimer: informational content. Trading and investing carry risk of loss, including loss of entire capital. Not investment advice.
Related · Onyqdesk tools
Sources: closing prices from public providers; QQQ, SPY and GLD options chains (Cboe, delayed); newsroom liquidations model and BTC perpetual open interest (Binance public data); US Bureau of Labor Statistics and Federal Reserve Bank of New York; newsroom economic calendar.
🇪🇸 Versión en español: Briefing semanal: la inflación de EE. UU. llega el miércoles con el Nasdaq y el S&P 500 cerca de máximos
What if the next piece reached you before it happened?
Monday to Friday, 1h35 before the New York cash open: the pre-market with levels, the calendar and the trading idea of the day. On Sunday, the weekly wrap and the week ahead. Free. No spam. One click to unsubscribe.



Leave A Comment
You must be logged in to post a comment.